
Jennifer Wisniewski
Data Analyst | Business Intelligence Specialist
I am a business intelligence specialist with 4 years of data analytics experience. I work to understand business needs, gather and manipulate data, and create dashboards that communicate insights.This website is a work in progress, but you are more than welcome to have a look around while I continue to work on more public projects ☺
Data Visalization
Dive deeper into data using visualization software.
Excel Dashbaords
Don't have a visualization tool? No problem! You can still have a functional interactive dashboard. I create visually appealing dashboards which help stakeholders understand their business at a glance using only Excel.
Data Science
Statistical modeling, predictive analytics, and advanced analytics
About ME
I'm Jennifer, a meticulous, organized, and communicative Business Intelligence Analyst. I hold a bachelor's degree in Global Management from the Thunderbird School of Global Management, and I'm currently pursuing a Master of Science in Data Science with a specialization in Business Analytics.According to a study published by Seagate Technology, over two-thirds of data available to enterprises remains unleveraged. Many businesses have access to data but are missing the bridge between raw data and digestible, actionable insights. I have a genuine passion for bridging this gap. My goal is to make data accessible to all so it can be utilized to drive decisions. I empower businesses to make informed decisions based on comprehensive data analysis.With over 7 years of experience in the insurance industry and an internship in e-commerce, I have had the opportunity to collaborate with diverse teams across the United States and Germany. Currently, I work full-time for a Fortune 500 company, where I am responsible for conducting data and product analysis, creating interactive infographics and dashboards, enhancing reporting, and more. I effectively communicate key findings to stakeholders and diverse audiences, recognizing the importance of tailoring presentations and visualizations to the target audience.When working with you, I will prioritize understanding your business goals and objectives. I offer a range of services to cater to your specific needs:Services:
💻 calculators in Excel (Have you ever shopped online for car insurance, and after your put in all the details about your car, how many miles you drive, your accident history, etc, and at the end, the website tells you their premium [your personalized cost of insurance]? I built the algorithm for this, for a commercial insurance product, in Excel for this major insurance company!)
💻 Data Analysis, Cleaning, Modeling
💻 Interactive Infographics (Data Visualization)Skills Used:
💻Advanced Excel
💻Power Query
💻 Power BI (including DAX to create Calculated Columns and Measures)
💻 Tableau
💻 SQL
💻 PythonI am excited to collaborate with you and contribute to your data analysis and visualization endeavors. Please feel free to reach out to me on LinkedIn, Upwork, or via email with any questions or to discuss how we can work together to achieve your objectives.I look forward to the opportunity of collaborating with you.
Jennifer Wisniewski

Data Science
on hold
Excel Dashboards
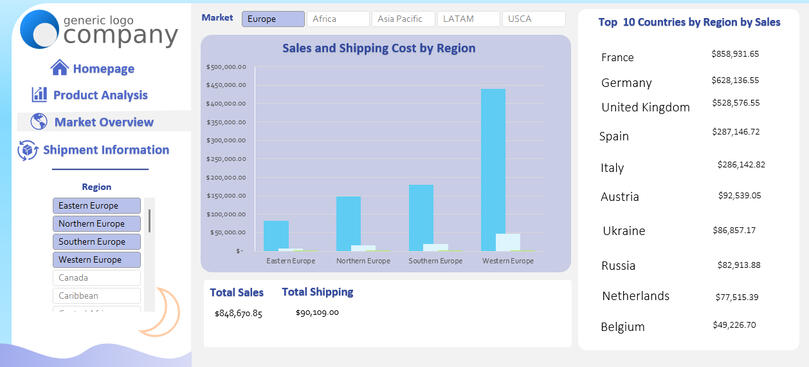
Example Project: Global Retailer Dashboard
The sample dataset is an international retailer which sells furniture, office supplies, and technology. I am in the process of creating an interactive dashboard in Excel where the executives can quickly view critical data.While I am still working on finishing up this project, the video below shows you what I have so far:
- ground work for background design
- interactive Sales and Shipping cost visualization, which you can filter by region
- dynamic list of the 10 countries with highest sales based on your selections
- Dynamic product search bar, which tells you product name and category (I am currently working on adding visualizations which respond to the user's entry to the search bar)This project is currently a work in progress. As it is a personal project I undertake in my free time, I work on it as it fits in. However, it should be noted I have previous professional experience building these type of dashboards end-to-end.
I create functional, attractive, and user-friendly dashboards using Business Intelligence tools. My primary objective is to ensure that insights from data are accessible to individuals at all levels within an organization. Throughout my career, I have successfully developed numerous end-to-end dashboards, catering to diverse requirements.
Some of my projects include...• audit result dashboards (analyzing audit results and tracking whether recommendations were implemented over time)
• insurance claims dashboard
• dashboards used for portfolio management
* IT ticket and Service Level tracker (monitoring assignments and percentage of tickets resolved within target time frame based on complaint type)
* dashboards used to for workflow management
• reporting on customer interaction with our company website... and more
Power bi dashboards

Tableau Dashboards
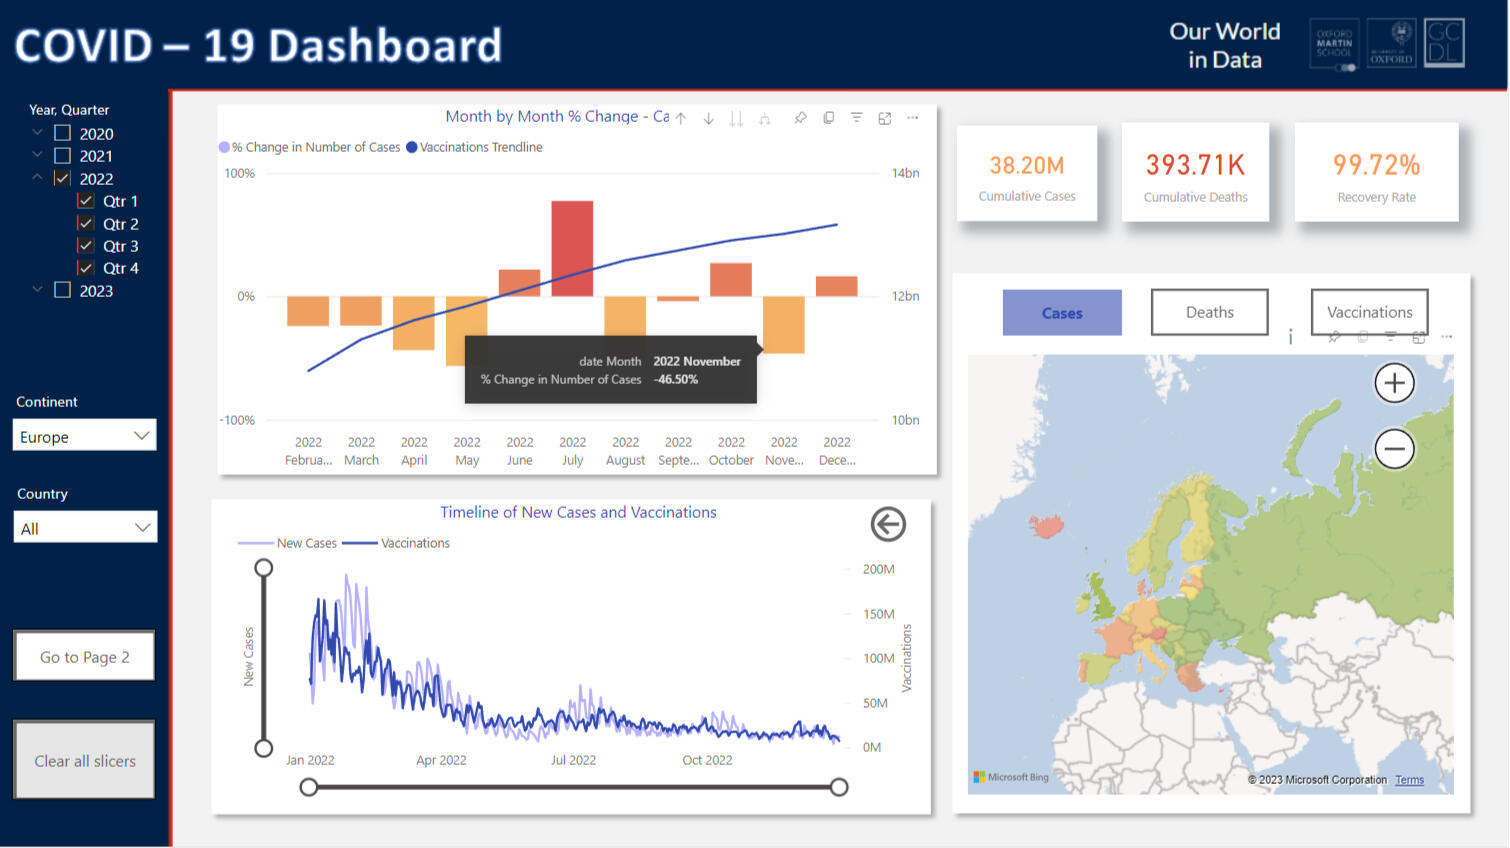
Example Project: Corona Virus Cases and Vaccines Global OverviewIn this project, I used data sourced from https://ourworldindata.org/covid-deaths to examine COVID-19 trends.
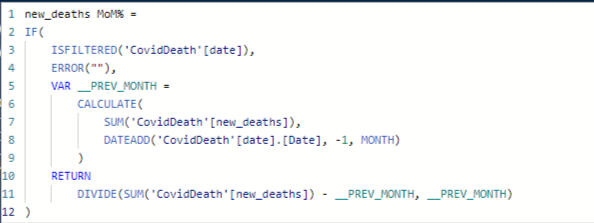
The first phase of the project was the data exploration. I used SQL to query the data and obtain a comprehensive understanding. Through a series of queries, I addressed specific questions that were later incorporated into the Power BI analysis.After establishing a live connection to the SQL Server database, I utilized Power Query within Power BI to make any necessary data transformations before proceeding with the visualization stage.My goal of the project was to create a comprehensive dashboard providing a global overview of COVID-19 cases, deaths, and vaccinations. The dashboard encompassed data from March 2020 to March 2023, offering insights into the pandemic's progression.I created some measures to determine the percentage change in cases versus the trend in number of vaccinations. My goal see if we could see a decrease in the cases following an increase in vaccinations administered.

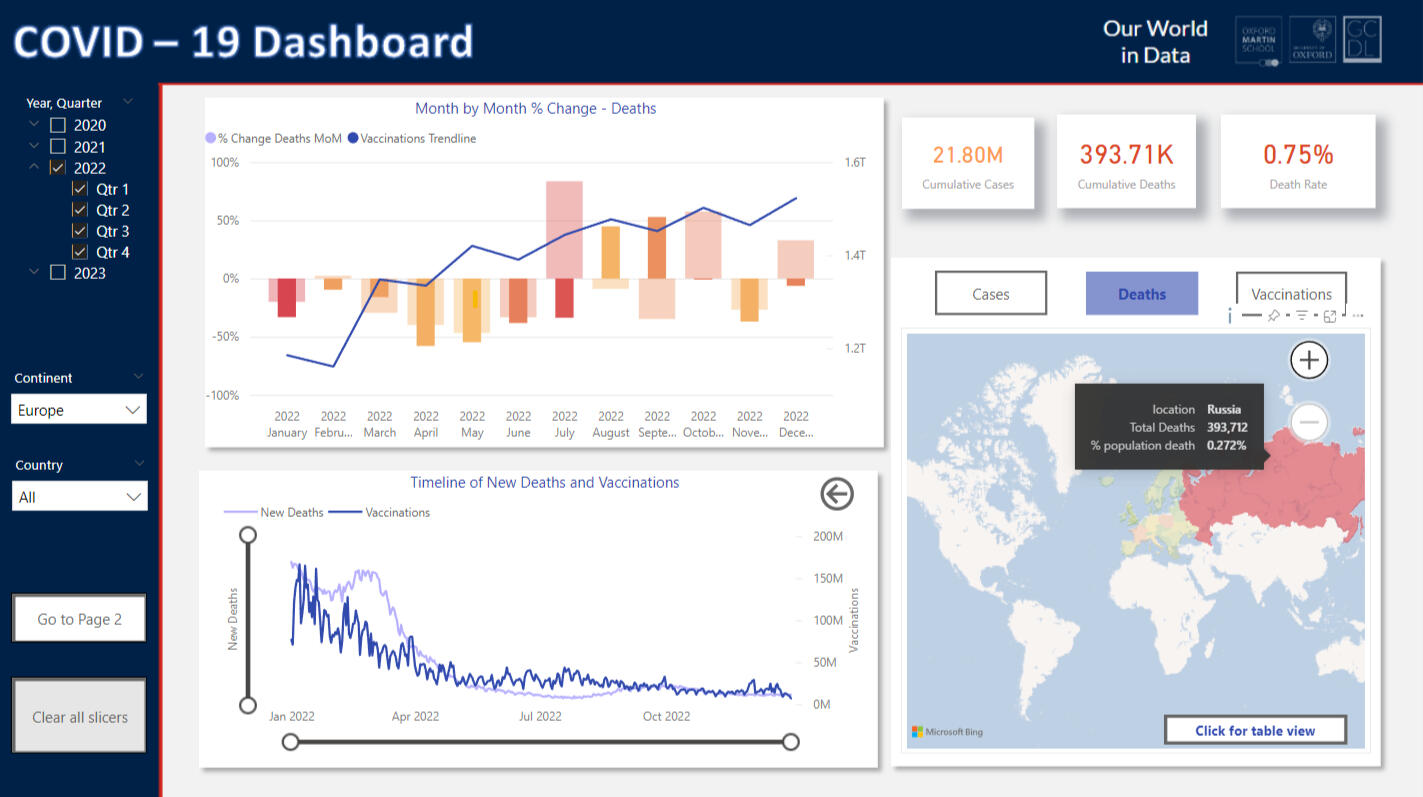
Below I have a screenshot drilled down on the COVID-19 death statistics in Europe for the year 2022. Specifically, I was intrigued by Russia, which exhibited the highest number of COVID-19 deaths within the continent. However, upon examining the table view (not pictured), it became evident that although Russia held this distinction, it ranked 22nd out of 55 countries in terms of deaths relative to its population. The average COVID-19 death rate in relation to the population stood at 0.258%, whereas Russia's rate was slightly above the average at 0.272%.Next, I compared Russia's death trend with the rest of Europe. Analyzing the percentage change column chart positioned on the upper left side, it became apparent that Russia did not experience the same spike in July as other European countries. Instead, the increase in cases and deaths was delayed, commencing in August and continuing through September.
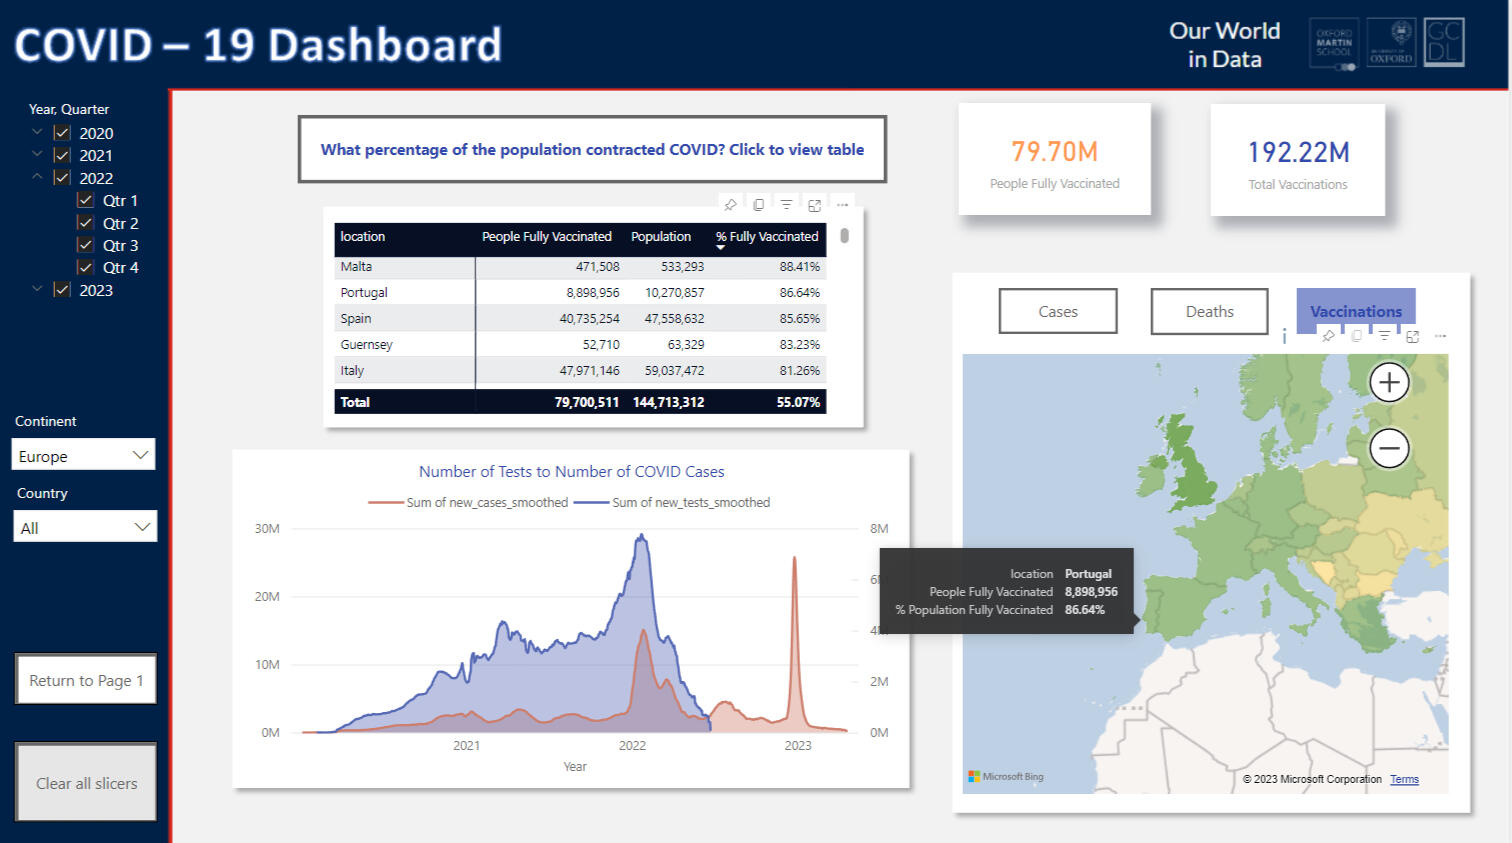
Let's take a look at the vaccine page. One of the key metrics I wanted to explore was the percentage of the population that had been fully vaccinated. In my screenshot below, the table displays the top 5 countries with the highest percentage of fully vaccinated individuals. By glancing at the map visualization, it becomes evident that Eastern European countries have a lower percentage of fully vaccinated individuals compared to their counterparts in the West. Expending the table allows me to see the how the percentage of vaccinated individuals relative to population range across Europe.Throughout the duration of this project, I ensured the accuracy of the data by cross-referencing it with the COVID dashboard published by the World Health Organization (WHO) Coronavirus Dashboard: https://covid19.who.int. It is worth noting that the WHO dashboard has been regularly updated since the completion of my project in April 2023. Nevertheless, my reports and findings align with the information presented by the World Health Organization at the time.
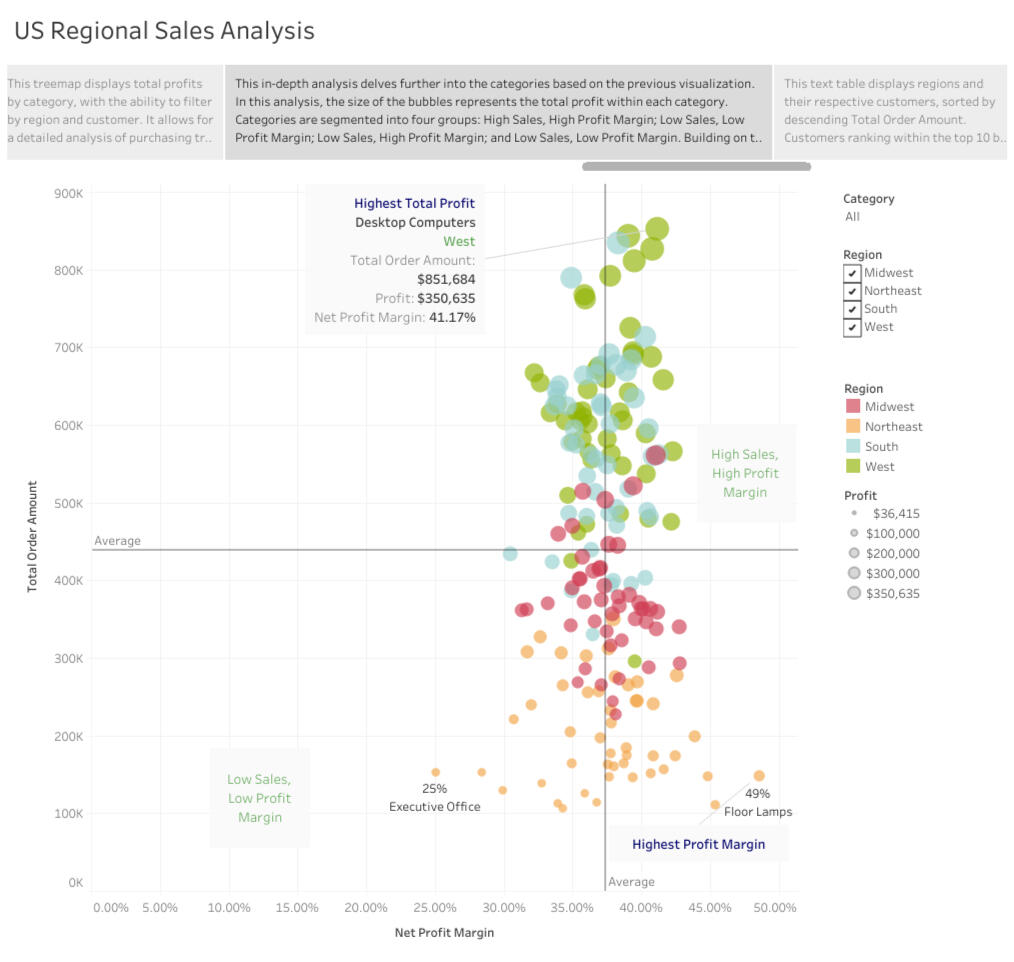
Example Project: Regional Sales Dashboard
The data story above provides key insights on business KPIs, concentrating on identifying products with the highest profit margin, to which customers the sales team should promote these projects, and top performers of the sales team. Click the link above to view this project in-depth.
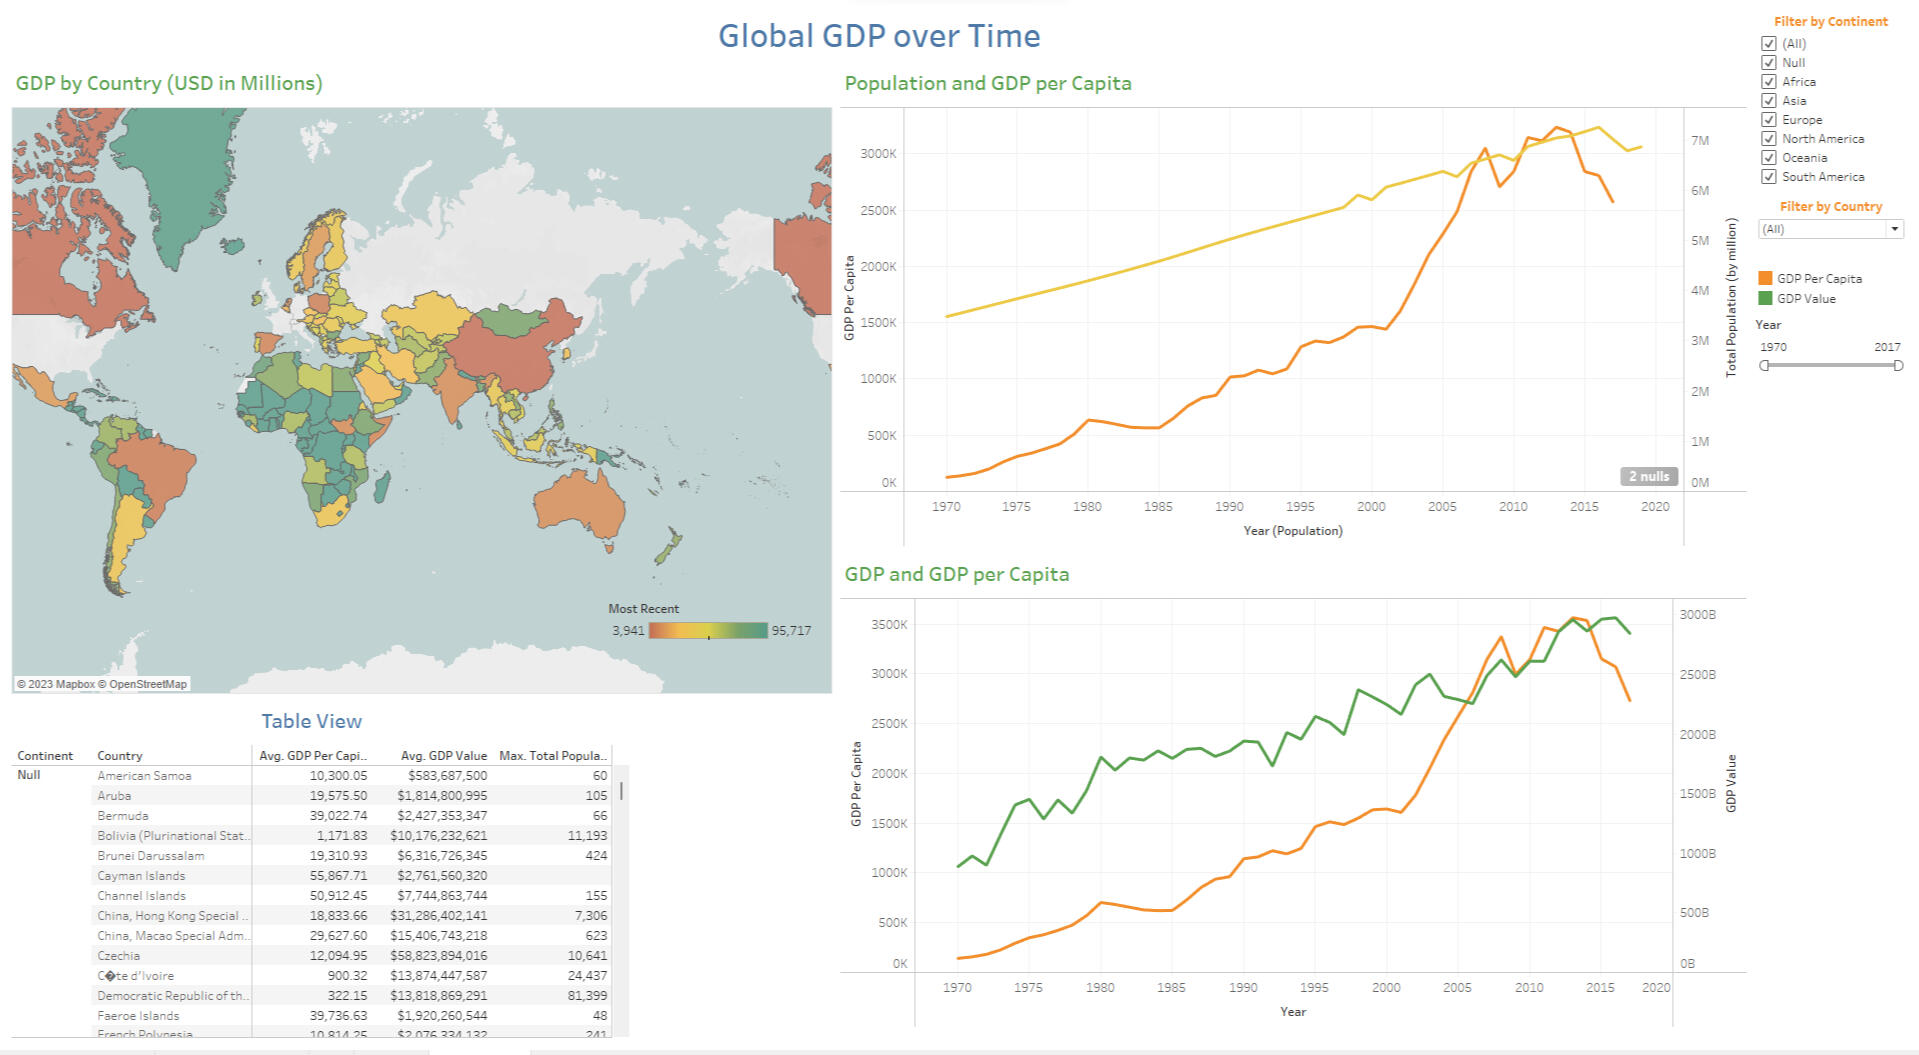
Example Project: GDP and Population Comparison
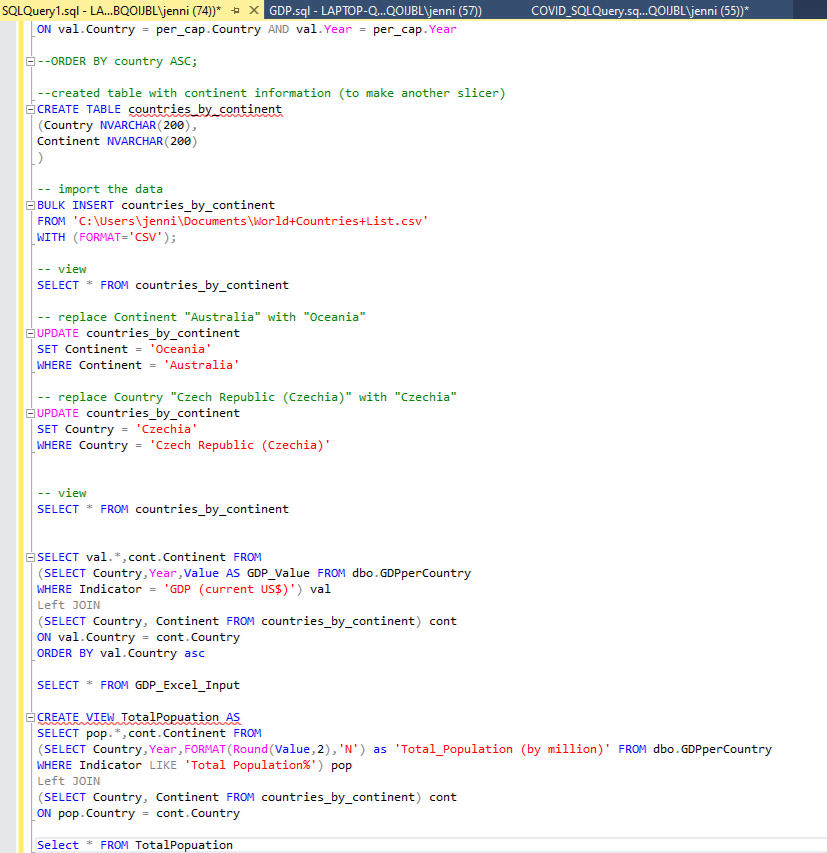
I found a public dataset containing GDP information by country (sadly did not save the source). However, I noticed that this dataset did not include information about continents or regions, which I intended to incorporate as a filter in Tableau.To address this, I sourced another public dataset that provided each country's corresponding continent. I imported this dataset into SQL as a separate CSV file. Before proceeding with the join operation, I made adjustments to the labeling to prevent any inadvertent null values.Next, I performed a join between the two tables based on the "Country" column. This join operation allowed me to incorporate the continent information into the dataset. Following the join, I conducted necessary formatting changes to ensure data consistency and readiness for subsequent analysis.Having completed these steps, I saved the query as a view, preparing it for Tableau.
advanced excel | SQL | Tableau | Power BI | R | python
"Jennifer is brilliant! She is a consummate professional and a whiz at data and analytics. She is a master at Excel, Power BI, SQL, Sharepoint etc. Her assistance and contributions to our operations and underwriting teams was invaluable. She explains formulas and concepts in very easy to understand terms and is always willing to help. She is an asset to any team and company that is lucky enough to have her. I hope our paths cross again!"Review from Upper Management
Education
Master of Science in Data Science, Business Analytics Concentration
Expected- May 2024
Eastern University
Current GPA: 4.00Bachelor of Global Management: International Business & Culture; German mino
Thunderbird School of Global Management at Arizona State University
4.00 GPA – Summa Cum Laude
Dean’s Circle Award – awarded at graduation for exceptional leadership and lasting contributions toward the university
Work Experience
AIG (American International Group Inc.) Phoenix, Arizona
Actuarial Analyst September 2022 - Current
• Revolutionized data workflows by automating manual processes from Excel to Power BI, resulting in increase productivity. Improved data analysis accuracy and efficiency, streamlining operations for enhanced productivity.General Insurance Analyst July 2022 - August 2023• Built the pricing system for a new General Insurance product. I used Microsoft Excel to build algorithms and complex formulas which consider different variables and territory-specific criterium to calculate the price of the insurance product based on user input. The result of the projects was given to the company's software developers, who programmed it to be the online rate/quote/issue system on our company website.
• Designed a new workflow for the auditing department, resulting in a 40% increase in efficiency of the auditing process. I automated numerous tasks and allowed for easy aggregation of the collected data. I then build a dashboard to track auditing KPIs which could be easily shared with stakeholders.
• Created customized Power BI dashboards. Some of my recent projects included:
o creating a dashboard to monitor user interaction our company's pricing website
o creating a dashboard to monitor catastrophic exposures, comparing YoY and by month percentage change, and calculated loss ratios, which assist senior leadership in developing our annual catastrophic budgetEra Zero Waste Berlin, Germany
Business Development Intern Sept 2021 - Dec 2021
• Developed email marketing strategy and used MailChimp to monitor interactions, resulting in a response rate of 25%
• Networked among local businesses to develop leads and generate new business, resulting in 3 new partners
• Managed client touch point interactions using CRM software, updated progress on collaborative tasks using project management softwareAIG (American International Group Inc.) Phoenix, Arizona
General Insurance Intern
Jun 2021 - Aug 2021
• Performed data analysis by reviewing potential loss, previous loss runs & market conditions
• Assessed a current commercial insurance policy and presented a recommendation for renewal to senior management
• Conducted commercial property valuations to ensure policiesBloom Insurance Agency Mesa, Arizona
Licensed Health Plan Advisor
Sept 2018 – May 2021
• B2C sales: conducted needs assessment and sold Medicare health insurance plans
• Drove team revenue totals by regularly bringing in top sales numbers- Top sales agent Oct 2018 – March 2019
Sales Manager March 2019 – Nov 2020
• Focused on sales data and reporting data using Excel and internal reporting tools for the business unit
• Improved agent reporting by improving workbook structure, creating KPI dashboards within Excel. Added automated fill-in capabilities to individual agent reporting to increase efficiency in communicating personal performance to agents
• Collaborated with the Program Manager to develop a comprehensive new hire training program
• Managed team of 10-15 sales agents